Category Archives: Folding

Distance Estimated Polychora

My last post mentioned some scripts that Knighty (a Fractal Forums member) made for distance estimated rendering of many types of polyhedra, including the Platonic solids. Shortly after, Knighty really raised the bar by finding a distance estimator for four dimensional polytopes. In this post, I’ll show some images of a subset of these, the convex regular polychora.

There are several ways to depict four dimensional structures. The 4D Quaternion Julia, one of the first distance estimated fractals, simply showed 3D slices of 4D space. Another way would be to project the shadow of a 4D object onto a 3D space. Ideally, a proper perspective projective would be preferable, but this seems to be complicatated with distance estimation techniques.

The technique Knighty used to create a 3D projection, was to place the polychoron boundary on a 3-sphere, and then stereographically project the 3-sphere surface onto a 3-dimensional space. For a very thorough and graphical introduction to stereographic projection of higher-dimensional polytopes, see this great movie: Dimensions. It should be noted that the Jenn3D program also uses this projection to depict a variety of polytopes (using polygonal rendering, not distance estimated ray marching).

Back to the structures:

The convex regular 4-polytopes are the four-dimensional analogs of the Platonic solids. They are bounded by three-dimensional cells, which are all Platonic solids of the same kind (similar to the way the Platonic solids are bounded by identical regular 2D polygons). The convex regular polytopes are consistently named by the number of identical cells (Platonic solids) that bounds them. In four dimensions, there are six of these, one more than the number of Platonic solids.

5-cell

The 5-cell (or 4-simplex, or hypertetrahedron) is the simplest of the convex regular polytopes. It is composed of 5 three-dimensional tetrahedrons, resulting in a total of 5 vertices and 10 edges. It is the 4D generalisation of a tetrahedron.

The curved lines are a consequence of the stereographic projection. In 4D the lines would be straight.

8-cell

The 8-cell (or hypercube, or Tesseract) is also simple. Composed of 8 3D-cubes, it has 16 vertices, and 32 edges. It is the 4D generalisation of a cube.

16-cell

Things start to get more complicated with the 16-cell (or hyperoctahedron). It is composed of 16 tetrahedrons, and has 8 vertices and 24 edges. It is the 4D generalisation of an octahedron.

Notice, that if we rotate the 3-sphere, we can get interesting depictions, with edges getting infinitely long in 3-space:

24-cell

The 24-cell is exceptional, since it has no 3D analogue. It is built from 24 octahedrons, has 24 vertices and 96 edges.

120-cell

The 120-cell is a beast, built from 120 three-dimensional dodecahedra. With 600 vertices and 1200 edges, it is the most complex of the convex, regular polychora. It is the 4D generalisation of a dodecahedron.

Zooming in, it is easier to see the pentagons making up the dodecahedra.

600-cell

Finaly, the 600-cell is built from an even larger number of polyhedra: 600 three-dimensional tetrahedrons. However, the simpler polyhedra means there is only a total of 120 vertices and 720 edges. It is the 4D generalisation of an icosahedron.

Knighty’s great Fragmentarium scripts can be found in this thread at Fractal Forums.

Knighty’s script is not limited to regular convex polychora. Many types of polytopes can be made. Here are the parameters used for the images in this post:

polychora06.frag parameters:

Type,U,V,W,T
3,0,1,0,0 - 5-cell
4,0,1,0,0 - 8-cell
4,0,0,1,0 - 24-cell
4,0,0,0,1 - 16-cell
5,0,1,0,0 - 120-cell
5,0,0,0,1 - 600-cell

And for completeness, here are the parameters for the 3D polyhedron script:

Type,U,V,W
3,0,1,0 Tetrahedron
4,0,0,1 Cube
3,1,0,0 Octahedron
5,0,0,1 Dodecahedron
5,0,1,0 Icosahedron

Distance Estimated 3D Fractals (IV): The Holy Grail

Previous posts: part I, part II, and part III.

Despite its young age, the Mandelbulb is probably the most famous 3D fractal in existence. This post will examine how we can create a Distance Estimator for it. But before we get to the Mandelbulb, we will have to step back and review a bit of the history behind it.

The Search for the Holy Grail

The original Mandelbrot fractal is a two dimensional fractal based on the convergence properties of a series of complex numbers. The formula is very simple: for any complex number z, check whether the sequence iteratively defined by \(z_{n+1} = z_{n}^2+c\) diverges or not. The Mandelbrot set is defined as the set of points which do not diverge, that is, the points with a series that stays bounded within a given radius. The results can be depicted in the complex plane.

The question is how to extend this to three dimensions. The Mandelbrot set fits two dimensions, because complex numbers have two components. Can we find a similar number system for three dimensions?

The Mandelbrot formula involves two operations: adding numbers, and squaring them. Creating a n-component number where addition is possible is easy. This is what mathematicians refer to as a vector space. Component-wise addition will do the trick, and seems like the logical choice.

But the Mandelbrot formula also involves squaring a number, which requires a multiplication operator (a vector product) on the vector space. A vector space with a (bilinear) vector product is called an algebra over a field. The numbers in these kind of vector spaces are often called hypercomplex numbers.

To see why a three dimensional number system might be problematic, let us try creating one. We could do this by starting out with the complex numbers and introduce a third component, j. We will try to keep as many as possible of the characteristic properties of the complex and real numbers, such as distributivity, \(a*(b+c)=(a*b)+(a*c)\), and commutativity, \(a*b=b*a\). If we assume distributivity, we only need to specify how the units of the three components multiply. This can be illustrated in a multiplication table. Since we also assumed commutativity, such a table must be symmetric:

\(
\begin{bmatrix}
& \boldsymbol{1} & \boldsymbol{i} & \boldsymbol{j} \\
\boldsymbol{1} & 1 & i & j \\
\boldsymbol{i} & i & -1 & ?\\
\boldsymbol{j} & j & ? & ?
\end{bmatrix}
\)
 
For a well-behaved number system, anything multiplied by 1 is still one, and if we now require the real and imaginary components to behave as for the complex numbers, we only have three components left – the question marks in the matrix. I’ve rendered out a few of the systems, I encountered while trying arbitrary choices of the missing numbers in the matrix:

(Many people have explored various 3D component multiplication tables – see for instance Paul Nylander’s Hypercomplex systems for more examples).

Unfortunately, our toy system above fails to be associative (i.e. it is not always true, that \(a*(b*c) = (a*b)*c\)), as can be seen by looking at the equation \(i*(i*j) = (i*i)*j \Rightarrow i*x = -j\), which can not be satisfied no matter how we choose x.

It turns out that it is difficult to create a consistent number system in three dimensions. There simply is no natural choice. In fact, if we required that our number system allowed for a division operator, there is a theorem stating that only four such mathematical spaces are possible: the real numbers (1D), the complex numbers (2D), the quaternions (4D) and the octonions (8D). But no 3D systems.

But what about the 4D Quaternions? Back in 1982, Alan Norton published a paper showing a Quaternion Julia set made by displaying a 3D “slice” of the 4D space. Here is an example of a Quaternion Julia fractal:

Of course, in order to visualize a 4D object, you have to make some kind of dimensional reduction. The most common approach is to make a 3D cross-section, by simply keeping one of the four components at a fixed value.

If you wonder why you never see a Quaternion Mandelbrot image, the reason is simple. It is not very interesting because of its axial symmetry:

If you, however, make a rotation inside the iteration loop, you can get something more like a 3D Mandelbrot.

The Quaternion system (and the 3D hypercomplex systems above) are defined exactly as the 2D system – by checking if \(z_{n+1} = z_{n}^2+c\) converges or not.

But how do we draw a 3D image of these fractals? In contrast to the 2D case, where it is possible to build a 2D grid, and check inside each cell, building a 3D grid and checking each cell would be far too memory and time consuming for images in any decent resolution.

A distance estimator for quadratic systems.

While Alan Norton used a different rendering approach, a very elegant solution to this was found by John Hart et al in a 1989 paper: distance estimated rendering. As discussed in the previous posts, distance estimated rendering requires that we are able to calculate a lower bound to the distance from every point in space to our fractal surface! A first, this might seem impossible. But it turns out such a formula already was known for the 2D Mandelbrot set. A distance estimate can be found as:

(1)   \(DE=0.5*ln(r)*r/dr\)
 
Where ‘r’ is the escape time length, and ‘dr’ is the length of the running derivative. (The approximation is only exact in the limit where the number of iterations goes to infinity)

In order to define what we mean by the running derivative, we need a few extra definitions. For Mandelbrot sets, we study the sequence \(z_{n+1} = z_{n}^2+c\) for each point c. Let us introduce the function \(f_n(c)\), defined as the n’th entry for the sequence for the point c. By this definition, we have the following defining formula for the Mandelbrot set:

\(f_n(c) = f_{n-1}^2(c) + c, f_0(c) = 0\)
 
Deriving this function with respect to c, gives

(2)   \(f’_n(c) = 2f_{n-1}(c)f’_{n-1}(c)+1\)   (for Mandelbrot formula)
 
Similar, the Julia set is defined by choosing a fixed constant, d, in the quadratic formula, using c only as the first entry in our sequence:

\(f_n(c) = f_{n-1}^2(c) + d, f_0(c) = c\)
 
Deriving this function with respect to c, gives

(3)   \(f’_n(c) = 2f_{n-1}(c)f’_{n-1}(c)\)   (for Julia set formula)
 
which is almost the same result as for the Mandelbrot set, except for unit term. And now we can define the length of \(f_n\), and the running derivative \(f’_n\):
 
\(r = |f_n(c)|\) and \(dr = |f’_n(c)|\)
 
used in the formula (1) above. This formula was found by Douady and Hubbard in a 1982 paper (more info).


2D Julia set rendered using a distance estimator approach. This makes it possible to emphasize details, without having to use extensive oversampling.

Due to a constraint in WordPress, this post has reached its maximum length. The next post continues the discussion, and shows how the formula above can be used for other types of fractals than the 2D Mandelbrot.

Distance Estimated 3D Fractals (III): Folding Space

The previous posts (part I, part II) introduced the basics of rendering DE (Distance Estimated) systems, but left out one important question: how do we create the distance estimator function?

Drawing spheres

Remember that a distance estimator is nothing more than a function, that for all points in space returns a length smaller than (or equal to) the distance to the closest object. This means we are safe to march at least this step length without hitting anything – and we use this information to speed up the ray marching.

It is fairly easy to come up with distance estimators for most simple geometric shapes. For instance, let us start by a sphere. Here are three different ways to calculate the distance from a point in space, p, to a sphere with radius R:

(1) DE(p) = max(0.0, length(p)-R)  // solid sphere, zero interior
(2) DE(p) = length(p)-R // solid sphere, negative interior
(3) DE(p) = abs(length(p)-R)    // hollow sphere shell

From the outside all of these look similar. But (3) is hollow – we would be able to position the camera inside it, and it would look different if intersected with other objects.

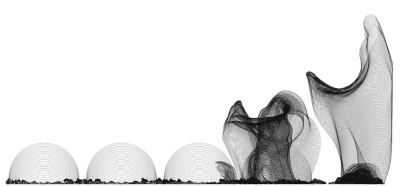
What about the first two? There is actually a subtle difference: the common way to find the surface normal, is to sample the DE function close to the camera ray/surface intersection. But if the intersection point is located very close to the surface (for instance exactly on it), we might sample the DE inside the sphere. And this will lead to artifacts in the normal vector calculation for (1) and (3). So, if possible use signed distance functions. Another way to avoid this, is to backstep along the camera ray a bit before calculating the surface normal (or to add a ray step multiplier less than 1.0).


From left to right: Sphere (1), with normal artifacts because the normal was not backstepped. Sphere (2) with perfect normals. Sphere (3) drawn with normal backstepping, and thus perfect normals. The last row shows how the spheres look when cut open.

Notice that distance estimation only tells the distance from a point to an object. This is in contrast to classic ray tracing, which always is about finding the distance from a point to a given object along a line. The formulas for ray-object intersection in classic ray tracing are thus more complex, for instance the ray-sphere intersection involves solving a quadratic equation. The drawback of distance estimators is that multiple ray steps are needed, even for simple objects like spheres.

Combining objects

Distance fields have some nice properties. For instance, it is possible to combine two distance fields using a simple minimum(a,b) operator. As an example we could draw the union of two spheres the following way:

DE(p) = min( length(p)-1.0 , length(p-vec3(2.0,0.0,0.0))-1.0 );

This would give us two spheres with unit radius, one centered at origo, and another at (2,0,0). The same way it is possible to calculate the intersection of two objects, by taking the maximum value of the fields. Finally, if you are using signed distance functions, it is possible to subtract one shape from another by inverting one of the fields, and calculating the intersection (i.e. taking max(A, -B)).

So now we have a way to combine objects. And it is also possible to apply local transformations, to get interesting effects:


This image was created by combining the DE’s of a ground plane and two tori while applying a twisting deformation to the tori.

Rendering of (non-fractal) distance fields is described in depth in this paper by Hart: Sphere Tracing: A Geometric Method for the Antialiased Ray Tracing of Implicit Surfaces. This paper also describes distance estimators for various geometric objects, such as tori and cones, and discuss deformations in detail. Distance field techniques have also been adopted by the demoscene, and Iñigo Quilez’s introduction contains a lot of information. (Update: Quilez has created a visual reference page for distance field primitives and transformations)

Building Complexity

This is all nice, but even if you can create interesting structures, there are some limitations. The above method works fine, but scales very badly when the number of distance fields to be combined increases. Creating a scene with 1000 spheres by finding the minimum of the 1000 fields would already become too slow for real-time purposes. In fact ordinary ray tracing scales much better – the use of spatial acceleration structures makes it possible for ordinary ray tracers to draw scenes with millions of objects, something that is far from possible using the “find minimum of all object fields” distance field approach sketched above.

But fractals are all about detail, and endless complexity, so how do we proceed?

It turns out that there are some tricks, that makes it possible to add complexity in ways that scales much better.

First, it is possible to reuse (or instance) objects using e.g. the modulo-operator. Take a look at the following DE:

float DE(vec3 z)
{
  z.xy = mod((z.xy),1.0)-vec3(0.5); // instance on xy-plane
  return length(z)-0.3;             // sphere DE
}

Which generates this image:

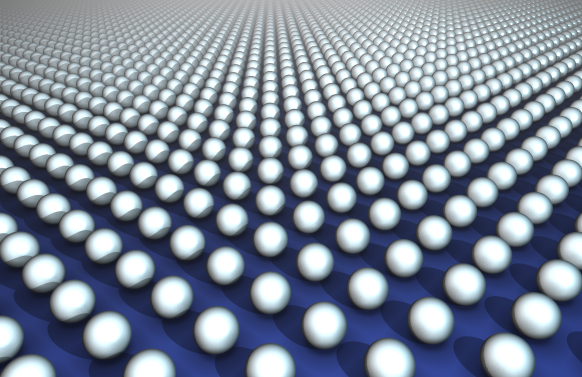
Now we are getting somewhere. Tons of detail, at almost no computational cost. Now we only need to make it more interesting!

A Real Fractal

Let us continue with the first example of a real fractal: the recursive tetrahedron.

A tetrahedron may be described as a polyhedron with vertices (1,1,1),(-1,-1,1),(1,-1,-1),(-1,1,-1). Now, for each point in space, lets us take the vertex closest to it, and scale the system by a factor of 2.0 using this vertex as center, and then finally return the distance to the point where we end, after having repeated this operation. Here is the code:

float DE(vec3 z)
{
	vec3 a1 = vec3(1,1,1);
	vec3 a2 = vec3(-1,-1,1);
	vec3 a3 = vec3(1,-1,-1);
	vec3 a4 = vec3(-1,1,-1);
	vec3 c;
	int n = 0;
	float dist, d;
	while (n < Iterations) {
		 c = a1; dist = length(z-a1);
	        d = length(z-a2); if (d < dist) { c = a2; dist=d; }
		 d = length(z-a3); if (d < dist) { c = a3; dist=d; }
		 d = length(z-a4); if (d < dist) { c = a4; dist=d; }
		z = Scale*z-c*(Scale-1.0);
		n++;
	}

	return length(z) * pow(Scale, float(-n));
}

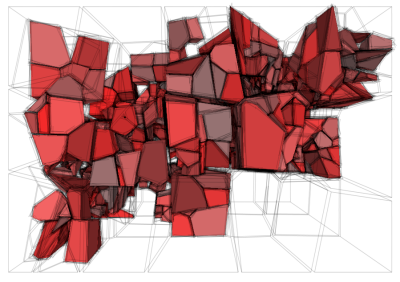
Which results in the following image:

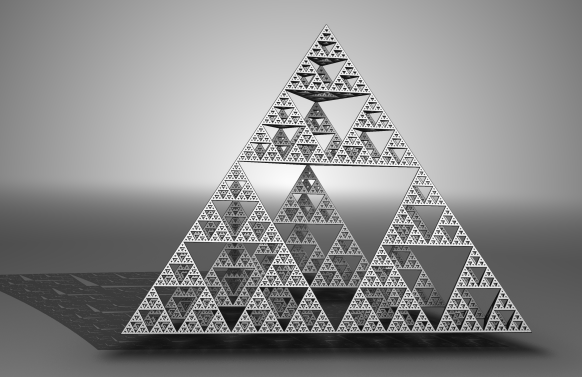
Our first fractal! Even though we do not have the infinite number of objects, like the mod-example above, the number of objects grow exponentially as we crank up the number of iterations. In fact, the number of objects is equal to 4^Iterations. Just ten iterations will result in more than a million objects - something that is easily doable on a GPU in realtime! Now we are getting ahead of the standard ray tracers.

Folding Space

But it turns out that we can do even better, using a clever trick by utilizing the symmetries of the tetrahedron.

Now, instead of scaling about the nearest vertex, we could use the mirror points in the symmetry planes of the tetrahedron, to make sure that we arrive at the same "octant" of the tetrahedron - and then always scale from the vertex it contains.

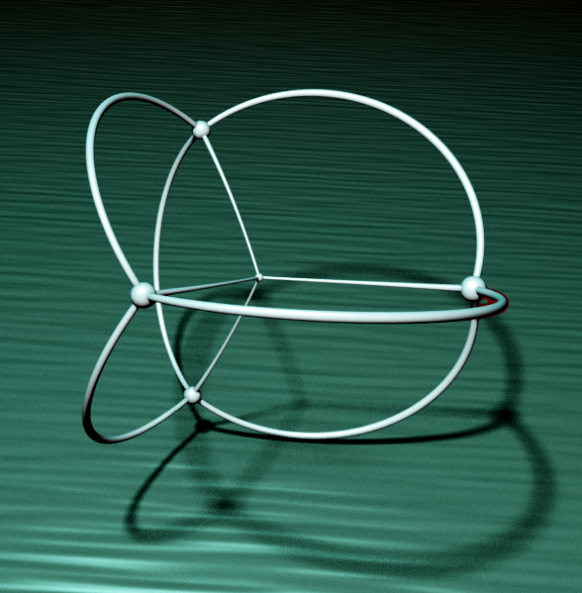
The following illustration tries to visualize this:

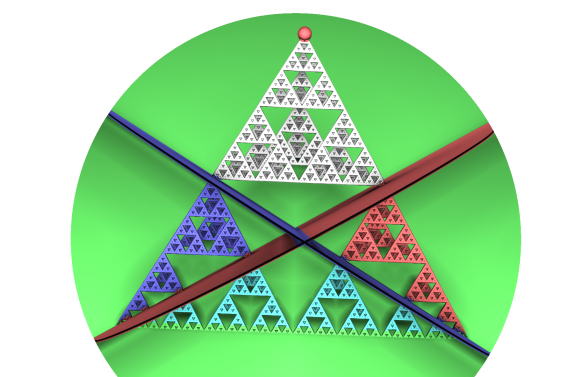
The red point at the top vertex is the scaling center at (1,1,1). Three symmetry planes of the tetrahedron have been drawn in red, green, and blue. By mirroring points if they are on the wrong side (the non-white points) of plane, we will ensure they get mapped to the white "octant". The operation of mirroring a point, if it is on one side of a plane, is called a 'folding operation' or just a fold.

Here is the code:

float DE(vec3 z)
{
    float r;
    int n = 0;
    while (n < Iterations) {
       if(z.x+z.y<0) z.xy = -z.yx; // fold 1
       if(z.x+z.z<0) z.xz = -z.zx; // fold 2
       if(z.y+z.z<0) z.zy = -z.yz; // fold 3	
       z = z*Scale - Offset*(Scale-1.0);
       n++;
    }
    return (length(z) ) * pow(Scale, -float(n));
}

These folding operations shows up in several fractals. A fold in a general plane with normal n can be expressed as:

float t = dot(z,n1); if (t<0.0) { z-=2.0*t*n1; }

or in a optimized version (due to AndyAlias):

z-=2.0 * min(0.0, dot(z, n1)) * n1;

Also notice that folds in the xy, xz, or yz planes may be expressed using the 'abs' operator.

That was a lot about folding operations, but the really interesting stuff happens when we throw rotations into the system. This was first introduced by Knighty in the Fractal Forum's thread Kaleidoscopic (escape time) IFS. The thread shows recursive versions of all the Platonic Solids and the Menger Sponge - including the spectacular forms that arise when inserting rotations and translations into the system.

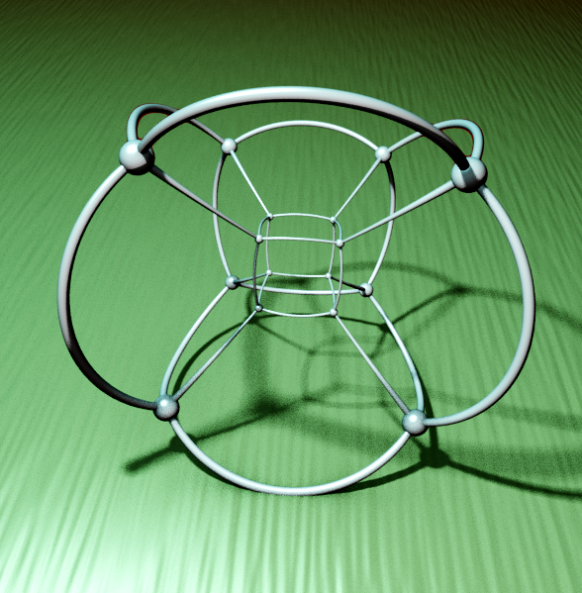
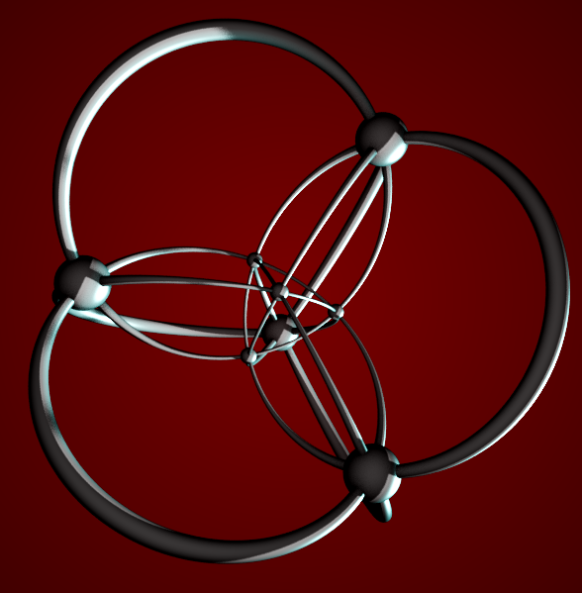
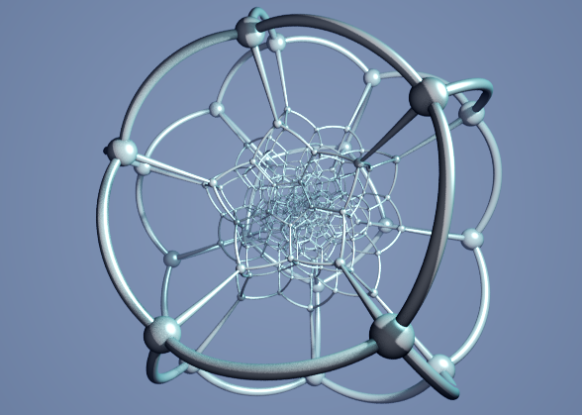
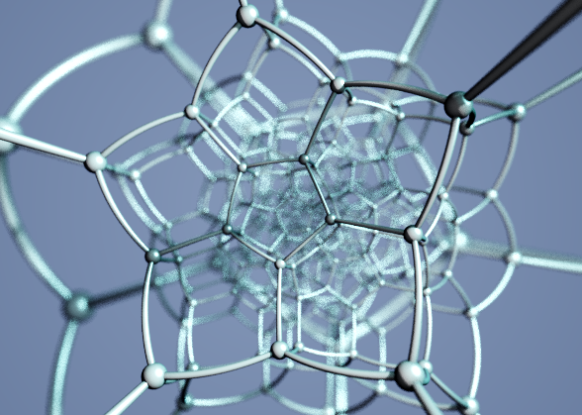
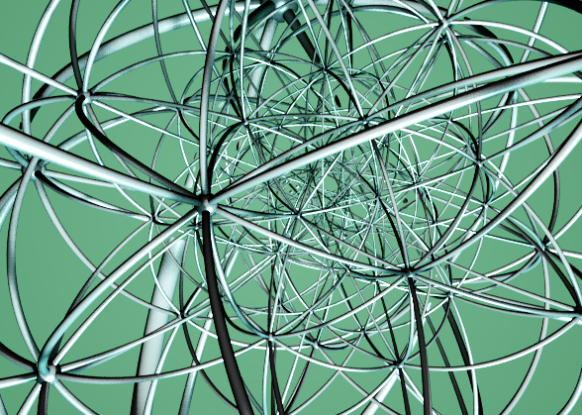
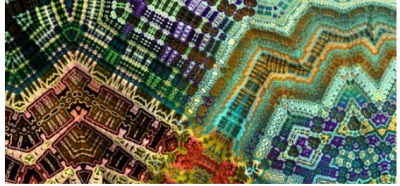
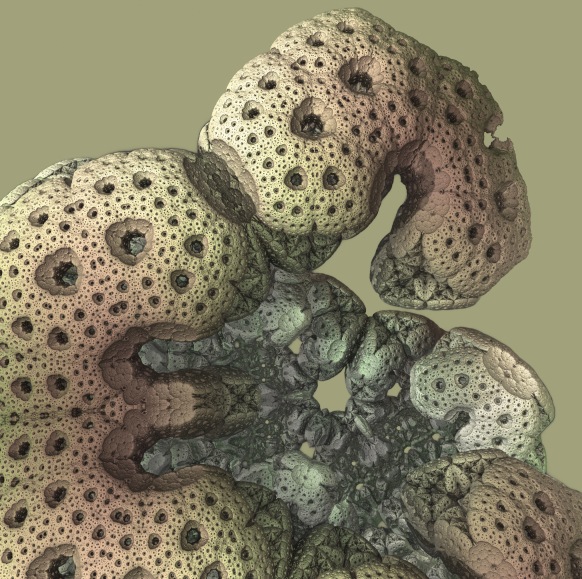
The Kaleidoscopic IFS fractals are in my opinion some of the most interesting 3D fractals ever discovered (or created if you are not a mathematical platonist). Here are some examples of forms that may arise from a system with icosahedral symmetry:

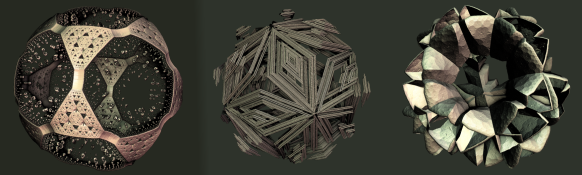
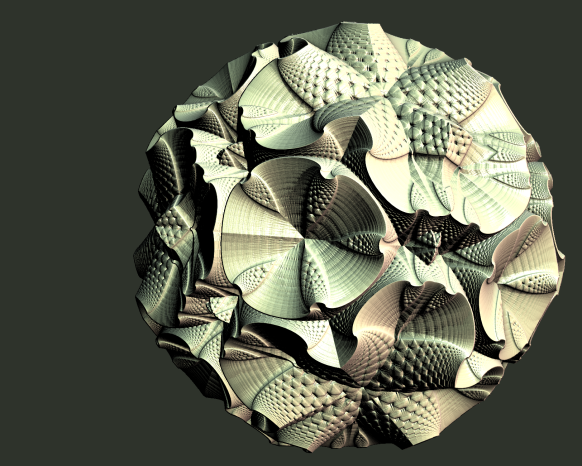
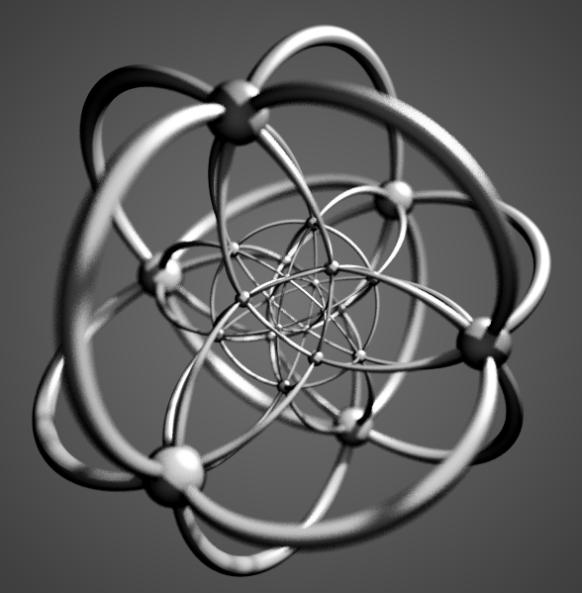
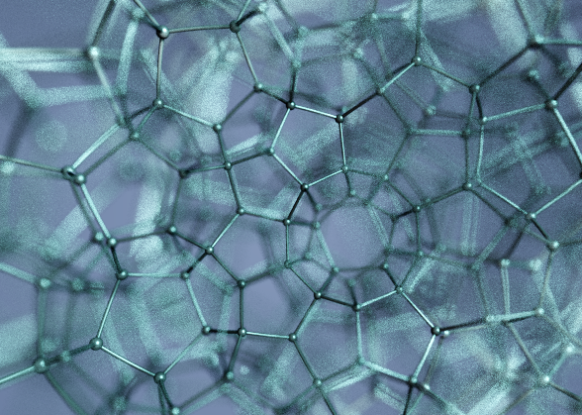
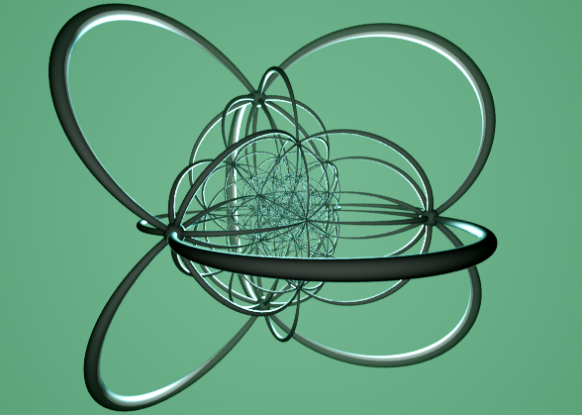
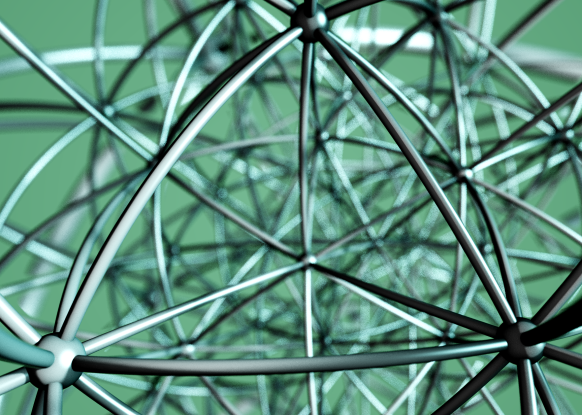
Here the icosahedral origin might be evident, but it possible to tweak these structures beyond any recognition of their origin. Here are a few more examples:


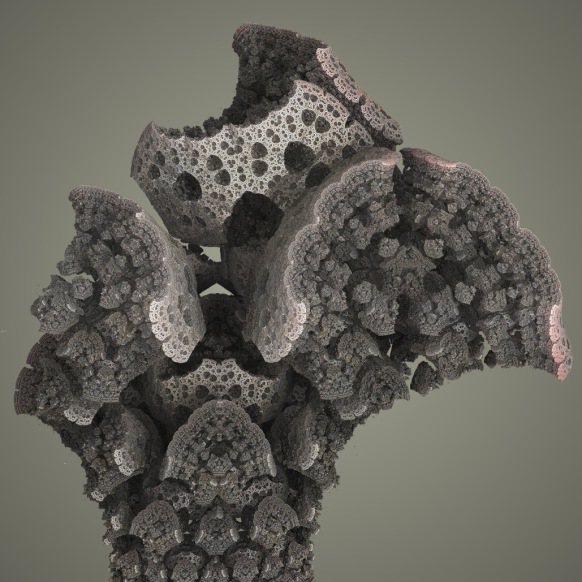
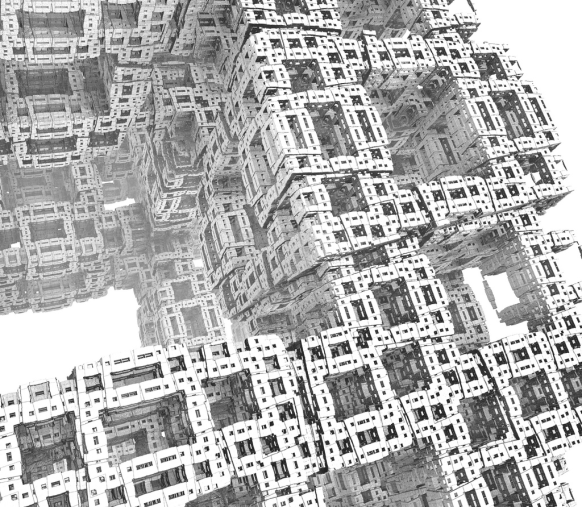
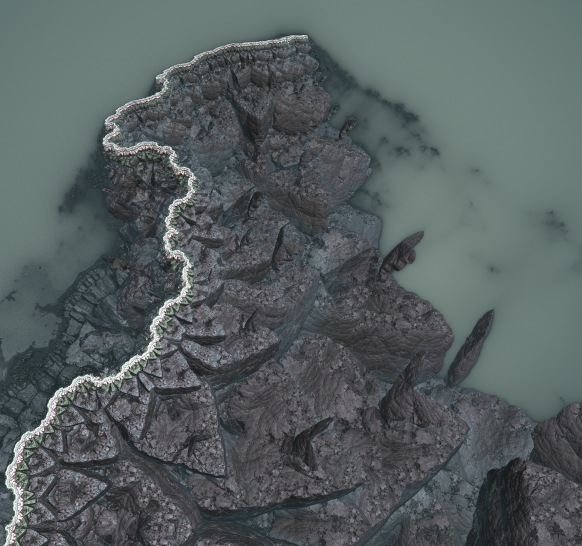
Knighty's fractals are composed using a small set of transformations: scalings, translations, plane reflections (the conditional folds), and rotations. The folds are of course not limited to the symmetry planes of the Platonic Solids, all planes are possible.

The transformations mentioned above all belong to the group of conformal (angle preserving) transformations. It is sometimes said (on Fractal Forums) that for 'true' fractals the transformations must be conformal, since non-conformal transformations tend to stretch out detail and create a 'whipped cream' look, which does not allow for deep zooms. Interestingly, according to Liouville's theorem there are not very many possible conformal transformations in 3D. In fact, if I read the theorem correctly, the only possible conformal 3D transformations are the ones above and the sphere inversions.

Part IV discusses how to arrive at Distance Estimators for the fractals such as the Mandelbulb, which originates in attempts to generalize the Mandelbrot formula to three dimensions: the so-called search for the holy grail in 3D fractals.

Written Images

Written Images is a generative book with artworks from different artists. All images are unique, created on-demand, when a new copy of the book is printed. 70 applications were submitted (see the overview video), and a jury selected 42 of these for the final collection.

Some of the submissions that caught my eye:

Cindermedusae

First, I think Marcin Ignac’s Cindermedusae is an amazing work. He generates imaginary sea creatures in the style of Ernst Haeckel.

Cindermedusae was created in Cinder and OpenGL, and generates images in near-realtime (one of the requirements for Written Images was a maximum calculation time of 15 seconds).

Division

W:Blut created Division for Written Images. It seems to be created using his interesting Hemesh library for Processing.

Origami Butterfly

Jonathan McCabe contributed with the Origami Butterfly. His images are created using an iterated folding process in 2D – which is interesting, because the Kaleidoscopic Iterated Functions Systems and the Mandelbox use a similar approach, but in 3D.

The Origami Butterfly process is described in a bit more detail at this post at Generator.x.

Jacob’s Cave

Jacob’s cave is made by Sansumbrella, created using Cinder. Intriguing complex shapes, yet very simple and elegant: